- Log in to Google Analytics
- Select a time frame, for example: Jan. 01, 2014 to Jan. 01 2015
- Select desired garrison or "All Web Site Data" if you wish to see overall stats
- Select a metric, for example if you want to know visits to a specific page:
- Click "Behavior/Site Content/ All Pages" then search for the name of the page (make sure you type it in exactly). if you don't get the page in the results, try typing only one of the keywords at first
- You can also type in (for example) "Sports" into the search and view all pages that include this keyword. This is a handy way to compare all pages within this category
- Select how many items you want to show per page
- Select how you want to view the results (bar graphs, pie chart, list, etc.)
- Once you are satisfied with what you see, click on Shortcut at the top of the page under the section title
- Name your shortcut. It will appear in the left-side pane.
- Visits. The graph with the visits per day provides an overview about the best and worst days of the month in terms of number of online visits.
- Traffic sources includes the top six sources that have directed the most traffic to your website in the last month. Some of the sources you can expect to see here are Google, social networks and possibly your website newsletter.
- Most popular content shows the top ten most-visited pages in your website. The home page is typically the most-visited page, followed by pages in your website navigation menu. Among the top ten, you might also find a popular blog post or any other page that has attracted the attention of online visitors.
- Total number of visits
- Percentage of new visits
- Traffic type overview
- Average visit duration
- Bounce rate
- Page per visits
- Keywords
About Google Analytics
Get a deeper understanding of your customers. Google Analytics gives you the free tools you need to analyze data for your business in one place. Whatever your industry – travel, automotive, healthcare, or beyond – Analytics helps you get a deeper understanding of your customers so you can deliver better experiences and drive results. Analytics makes it easy to understand how your site and app users are engaging with your content, so you know what’s working and what’s not. See how people are interacting with your sites and apps and the role that different channels play by viewing robust reports and dashboards. For more information on Google Analytics, visit the following website: https://marketingplatform.google.com/about/analytics/
Google Analytics Training
Google provides free training for their analytics platform. Training can be found at the following website: https://analytics.google.com/analytics/academy/
Enterprise Web Data Analysis Services
G9 Marketing provides data analysis services via a contract with Portland Labs Inc. for all Enterprise Web users. To request further analysis of your website or to request a “deep dive”, send an email to: Support@MWR.Zendesk.com
Enterprise Web Google Analytics Global Reports
G9 Marketing receives detailed Google Analytics reports for all Enterprise Web websites on a monthly basis. All reports can be accessed at the following SharePoint site: https://army.deps.mil/army/cmds/imcom_G9/G9/Divisions/marketing_dm_analytics
Google Analytics Account Request Instructions
1. Before requesting access to the Enterprise Web Google Analytics Account you must create a Google Account using your official .mil email address. Personal email accounts are not authorized per AR 25-1. Steps 2-20 provide instructions for creating a Google Account with your official .mil email address.
2. Go to the following website: https://accounts.google.com/
3. Click on Create Account.
4. Click Next. 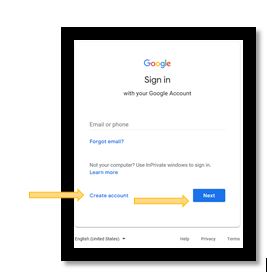
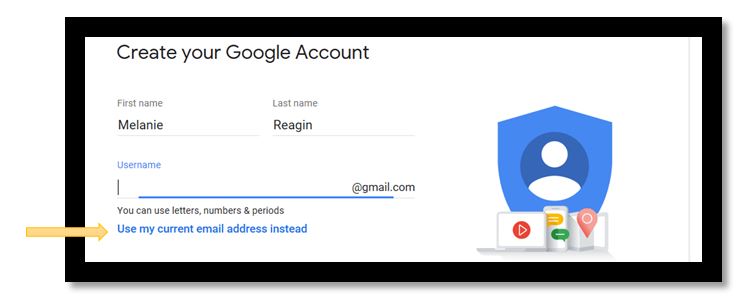
5. Enter your first and last name.
6. Click on Use my current email address instead.
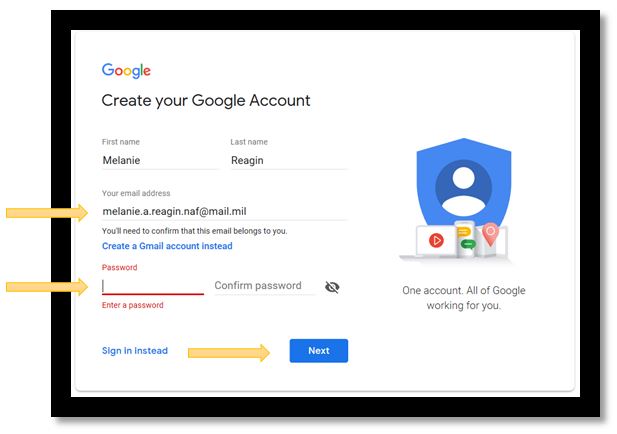
7. Enter your official .mil email address. Non .mil email addresses are not authorized per AR25-1.
8. Type in your password.
9. Confirm your password.
10. Click next.
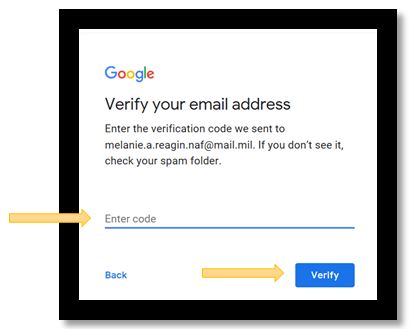
11. You will receive an e-mail with a verification code.
12. Enter the verification code you received via email.
13. Click on Verify.
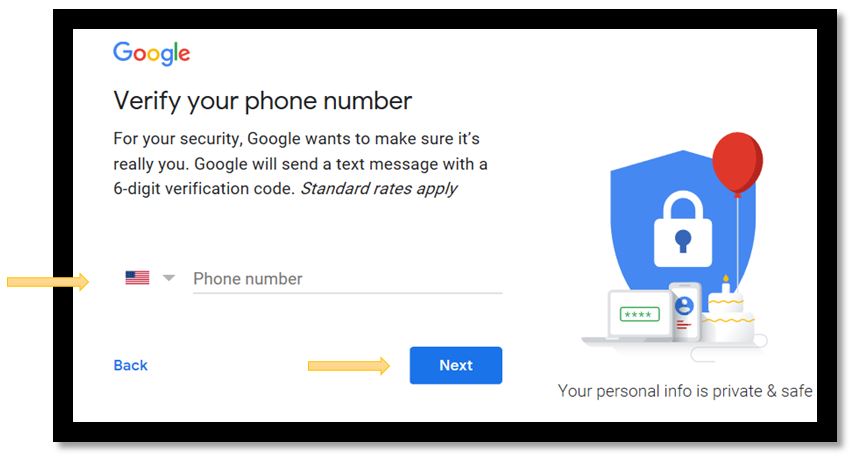
14. Enter your cell phone number. This step is to verify your identity only.
15. Click next.
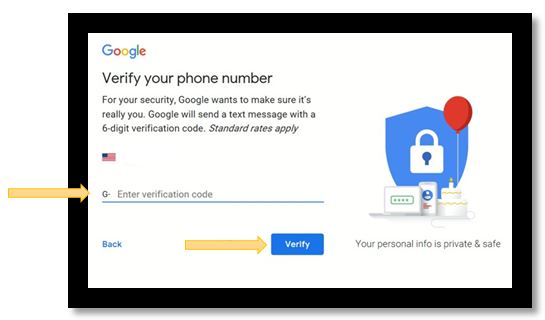
16. You will receive a text message on the cell phone number you provided with a verification code that starts with G-XXXXXX.
17. Type in the verification number you received via text message.
18. Click Verify.
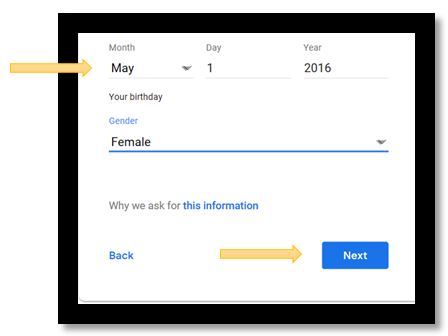
19. Enter your birthday.
20. Select your gender.
21. Click next.
22. After successful completion of setting up a Google Account using your official .mil email you will request access to the Enterprise Web Google Analytics account.
23. Go to the following SharePoint site and follow the instructions for requesting access: https://army.deps.mil/army/cmds/imcom_G9/G9/Divisions/Lists/mkt_dm_accts/AllItems.aspx
Google Analytics for Enterprise Web
Each section of Google Analytics has an integrated tutorial to help you take full advantage of the data your site offers. Most Enterprise Web marketers are interested in getting statistics for their websites and specific pages.
Here’s a basic starter:
1. Log in to Google Analytics: https://analytics.google.com
2. Select your garrison (scroll down, left-side menu)
3. Scroll down to Behavior (the selection under Acquisition). Click it
4. Select Overview
5. Scroll to the bottom, Right, select VIEW FULL REPORT. You'll see the data for your facilities appear at the top of the list.
This starter guide will help you understand how to access your web traffic data:
Getting started with Google Analytics for Enterprise Web users
Analytics: Creating Report Shortcuts
Shortcuts enable you to create, name and save reports in your dashboard.
To rename or delete a shortcut, click Overview. The dropdown on the right side of the screen provides options.
Here's a quick YouTube tutorial on how to create a basic shortcut.
Automatic Analytics Email Reports
Google Analytics has a setting that enables you to receive regular, monthly reports about your website user traffic.
1. Login to Google Analytics
2. From the Home screen, choose the garrison you want to know about. The Reporting window will pop open.
3. In the Date menu, click on the dropdown date and choose To Compare to Previous Period. Click Apply. If you do not want to receive comparative reports, you can skip this step.
4. Click Email
5. In the To field, type in the email address to whom the report should be sent
6. In the Frequency field, choose Monthly. Leave the Day of the Month as “1st”
7. In Advanced Options, choose Active for 12 Months
8. Press Send
The report will be sent the first day of each month and will compare the last month results with the previous month.

You can manage scheduled emails at “Admin/Assets/Scheduled Emails”.
The Dashboard we created offers three general metrics:
On the right column of the dashboard, it’s possible to find additional metrics: